Monday, August 31, 2009

Update for 31 Aug 09…

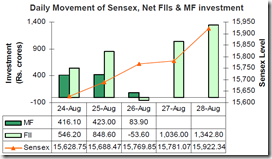
image So another month passes by and as we look back – all said and done it has been a fairly good swing so far. Now all that remains is the last day to go by peacefully and that would be another achievement. Timagehe achievement may not be too much on the Nifty closing up this month – but the fact that the Nifty fell and recovered all the losses to close above in green on the monthly basis. Well there is today to be seen still. The FII and DII data as given by the SEBI is pasted above. On the weekly basis we are doing better than other markets. That by itself should be some consolation and an achievement. Before I move on to discuss other things some points that one can keep in mind before we end this month are:-

  • PCR is generating bullish signs.
  • India VIX has declined 524 basis points in last five days to close at 33.27% last week.
  • FIIs seem to have become net buyers in out markets in the last five days. Though on monthly basis they have been net sellers.
  • Crude prices seems to be hovering around the unchanged mark ending the week –1.15% at 72.49 $ a barrel.
  • Inflation seems to be recovering and may come in positive soon. at the moment for the week ending 15 Aug it was at -0.95%.

image image As far as the Global cues on the last closing are concerned the Asia was all green except Hang Sang that closed 0.71% in red. Nikkei was in green up 0.57% and Strait Times was green 0.02%. Europe started the day green and ended green. FTSE was up 0.81%, DAX up 0.86% and CAC up 1.22%. US was confused at its best – oscillating between red and green to end mixed. Dow down 0.38%, Nasdaq up 0.05% and S&P down 0.20%. So like I said – confused. Bloomberg says that as per the consumer confidence, hosing data and Tech company earnings the recession is ending. Nikkei has opened in green and is up almost 1.77%.

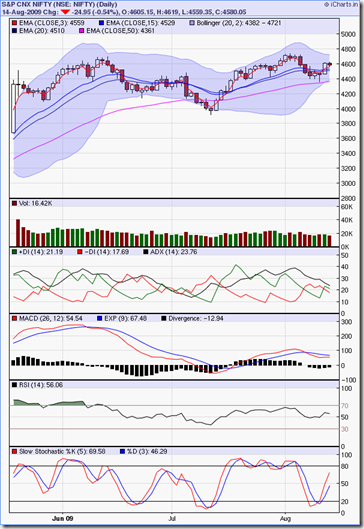
image Now as far as the candles on Nifty are concerned it was a white candle but it did not touch the upper Bollinger Band. On 315 – the 3 EMA continues to be above the 15 EMA and is a good sign. Volumes recovered a bit being 107% of last 50 Day average. RSI is rocking at 62.31 and the SMA (15) for RSI stands at 53.71. ADX still trails at 14. Slow Stochastic - %k and %D lines are almost overlapping and are in the overbought zone so some caution on that account is necessary. TRIX is looking up. MACD is bullish.

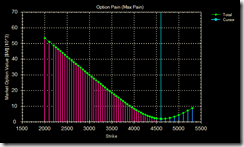
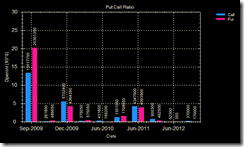
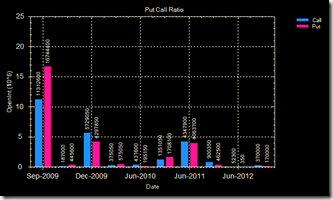
Put call 28 Aug 09 The options data as of now supports longs only with the put call ratio in nifty 1.45. The open interest is – 36.73 lac Put 4500, 31.83 lac at put 4300, 30.38 lacs in call 4900, 29 lacs in 4000 put, 5000 call and 4600 put. As per this we should now have a good run till about 4900 levels unless the Options data changes due to some reason drastically. Please take a look at the graphs also.Option pain 28 Aug 09

To summarise – Global cues are good to neutral. All the indicators baring Slow Stochastic and ADX are rocking. Slow Stochastic is overbought – but like I have said many times before it has a capacity to remain overbought and oversold for fairly long periods of time. ADX – yes it is an important indicator and till the time I see the markets in an upmove with ADX crossing 20 from below – I will keep saying that ideal strategy is that of cautious longs. All those who went long should trail stoploss on closing basis – do not hold longs if market closes below 4652, for those who are still bearish do not hold shorts if the markets close above 4716. For the day go long and remain long above 4684 and short below that level. Hope that this week too rocks. Only know that historically Sep and Oct are not too good a months for markets.


allvoices

Friday, August 28, 2009

Heads Operators win, Tails I loose… Update for 28 Aug 09…

image imageI would like to first get up and salute the perfect manner in which the closing of the markets was planned out that we hit the nail on the head.  It is phenomenal to see the markets singing to the tune of whomsoever the operators are. The markets were supposed to be range bound – basically due to the open interest that was there at the levels of 4600 and 4700. You can see it from the option pain chart – the markets closed to the perfection. What happened today is not important – what will happen tomorrow is extremely important. The possibilities are of breaking the range upwards or downwards and remaining range bound does not seem to be an option as of now – all the same it will be the way the markets want. The opening may be dictated by the Global cues but thereafter we should get on with the business of ‘doing something’. The verdict is ofcourse divided as I have called out so many times before so it remains to be seen where we are off too.

Daily 27 Aug 09 Now as far as the global cues are concerned – heading south seems to be the natural place to be. Asia traded fairly negative with only Strait Times ending in green. Infact Strait Times too started in red but steadily recovered to close 0.53% in green. Nikkei ended 1.56% red, and Hang Seng ended 1.04% in red. Europe spent the entire day round the flat line as there was no trigger – either good or bad. As the US opened Europe saw red and closed down FTSE down 0.43%, Dax down 0.94% and CAC down 0.54%. US had economic data where in GDP declined by 1% (better than expected), consumer spending contracted by 1% against 1.2% and jobless claims were down by 10,000. All this news dropped the US indices – but later due to drop in US dollar – led to better energy performance and that led to recovery among US – Dow ened up 0.39%, Nasdaq up 0.16% and S&P up 0.28%. Mind you there is still no good news out of US – GDP is still contracting. Though the Nikkei has opened green – the Japan’s unemployment rate has hit record high this July and the prices fell at a record pace. So all may not be good.

As far as the charts are concerned – though it was manipulated perhaps – the fact is that the markets are not touching the upper Bollinger Band. As of now the markets seem to be topping out – but like I said earlier – today will be the day that will show the correct direction. 315 remains bullish and all the EMA lines are facing up. Volumes too have been shade better. The candle was very near to a Doji but not a classical one. Volumes were shade higher than average. ADX still is trailing at 14 and mind you I went through all the charts of Nifty stocks – except for some IT stocks – the ADX is below 20 – giving indication of non trending markets. MACD has a bullish indication and a negative (read bearish) divergence. RSI is the same – Bullish with negative divergence. Slow Stochastic are overbought and one can expect a correction of sorts soon. TRIX is looking up. We have hit a roof for the third time now – if we do not push our way through it then expect a substantial drop down.

put call ratio 27 Aug 09 Though it may be too early to play out the Options data – but all the same – I will give out nifty pain and open interest. I saw someone giving out PCR for all individual strike prices on to read the greed and fear at those levels but am not sure if it works well – I would request anyone who has worked on that system to educate me if possible. The Nifty Put call ratio is 1.5 as of now with major call build up at 4900 level and Put build up at 4500 levels.

To summarise the Global cues may not be good today. Most of the indicators are bullish be with negative undertones/divergences. I would be extremely cautious in this month as I believe historically this has not been a good month for markets. Options are frankly giving a wide room to the markets to manoeuvre as of now with call build up at 4900 level and put build up at 4500. But I will say again that it is too early to read the option data for market manoeuvres as of now. Ideal strategy still would be cautions long with stop loss of closing below 4629. For those who are carrying on with shorts do not hold shorts if the markets are likely to close above 4693. For the day be long above 4651 and short below it.

Best of luck to everyone for today.


allvoices

Thursday, August 27, 2009

Expiry! Update for 27 Aug 09…

image

So finally the month will end and this uncertainty will die with it – where do we go now? There are two equally convincing proposals that are being projected as what will be – for the next month. One say that the markets will breakout on the upside and go on to test atleast 4850 level at the very least and the second say that the markets will correct sharply and we will see levels much lower than we have imagined. As I see it the bullish version is the one that is buying more credibility with more and more people convinced that the markets are getting into the safe zone. How safe? – only time will tell. The factors favouring the upswing are – rising wedge, closing above the Psychological barrier of 4650, inverse head and shoulders, majority of the indicators that I follow. And that in favour of the bears are – no meaningful correction for a long time, China factor, ADX and Triple Swing(explanation is there on Jaggu’s Blog). Now you can have your pick.

Daily 26 Aug 09 The global cues are mixed to say the least – In Asia Nikkei closed 1.36%up, Hang Seng up 0.1% and Strait Times up 0.37%. Europe was not so lucky and it opened red – made a couple of sincere efforts to go green – failed and ended red.FTSE down 0.53%, Dax down 0.63% and CAC 0.33%. US started the session red but soon went green only to oscillate the entire time between green and red finally closing green – just above the flat line. Dow was up 0.04% up, Nasdaq up 0.01% and S&P up 0.01%.

 Option pain 26 Aug 09 As far as the candles are concerned – I have an observation – firstly the candles are not trailing the upper edge as I had expected – the most plausible reason is the cal writers do not want the expiry above the 4700 levels. So like I said earlier – the move will happen starting tomorrow onwards. The 315 generated a buy three days back and that has been good so far.All lower EMAs are above the higher EMAs so bullish run continues. Volumes have picked up but that could be due to the rollovers/expiry. ADX is just in no mood to move a bit whatsoever – I have infact tapped my screen as to whether the ADX has not got struck there only – The reading is 14 so this upmove has less meaning to it and there is no trend in place. MACD is bullish. RSI is bullish and Slow Stochastic inspite of being in bullish mode – are overbought. TRIX has also started looking up.

Put Call ratio 26 Aug 09As far as the options data is concerned the 4700 call for this month has the maximum open interest. What should be important to us now is the Sep open interest – but I should tell to that to read the data – of next month is not all that beneficial so early in the next expiry. All the same the build up of open interest for next month is (from high to low) Almost 25 lacs plus In 4500 Put> 4000 Put > 4300 Put. As far as the calls are concerned 21 lacs in 5000 call and 20.5 lakh in 4900 call. Put call ratio is terribly in favour of the bull with the ratio 1.48. So much negativity – I am bullish for the time being whatever be the outcome. Also see the option pain chart – we are ending the month at the point of minimum option pain.

Okay ideal strategy on all counts (baring ADX and overbought Stochastic) is bullish. If I read it correctly 4700 may be taken after expiry. So ideally you should have already been long with stoploss of close below 4593 and if still short for whatever reason keep stoploss of 4676 on closing basis. For the day safe to be long above 4627 and short below it. Just a word – Asia has opened weak…

Best of luck to everyone – have a ball making money today…


allvoices

Wednesday, August 26, 2009

Hangman Candlestick! – so what?? Update for 26 Aug 09…

image I personally feel that we are now bullish to the point of being stupid – but then what? The markets never listened to me. The day will come when retail will be caught up in a web of self induced enthusiasm – the enthusiasm that will blind them and they will then grope in the dark while the markets will play out something unexpected. All the same till the time the party is on – remain on a edge and play out. The candle stick made yesterday was a Hangman Candlestick. Basically it comes after a trend up and has a potential to change the trend. It is perhaps not correct to use this as we are not in a typical trend and upswing (or for that matter of downswing) is of 3 or 4 candles. But all the same it can signal a reversal.

The Global cues are mixed at the best with positive vibes and some caution. The Asia had closed in the red after making attempts to go green. Nikkei was 0.79% down, Hang Seng down 0.49% and Strait Times was up 0.25%. Europe took cues from Asia and opened in red then sensing good day in US closed in green – almost at the days highest. FTSE was up 0.42%, DAX up 0.68% and CAC up 0.78%. The US opened in green and then quickly went up almost a percent plus. Thereafter it dropped to close at the levels of opening – not really flat but somewhere there. Dow was up 0.32%, Nasdaq was up 0.31% and S&P up 0.24%.

daily 25 Aug 09 As far as the candles are concerned – the markets are now pushing the bullish envelope. We are just a tick short of upper Bollinger band. On 315 we are comfortably on a – buy. But the markets have crisscrossed this lines four times earlier so a typical breakout has not happened. Like I said yesterday we can test the upper Bollinger band limit at 4747 and for the time being that should be it. The volumes increased somewhat with nifty logging average 50 day volumes. Ofcourse this is expiry week so activity increases as there are rollovers to consider, new positions to open or old ones to close. Absolutely surprisingly – ADX does not budge a bit – trailing at 14 (I hope my software is not struck) Weak – it shouts on top of its voice. Typical divergence with markets going to new highs without support of ADX. RSI is rocking and bullish at 58. Slow Stochastic is bullish  but with %k line in overbought territory. MACD has given its first bullish tick. I do have to agree that most of the indications are bullish.

The Broadband is not playing up so the options data is not loading. Pardon me for that so we go on without the options data. The global cues are still bullish and so are most of the indications on the candlesticks. Only words of caution in the winds are the candle itself – the Hangman and ADX that is not showing this upswing as a trend. The ideal strategy is to remain long with a stoploss of 4507 on closing and if short a strict stoploss of closing above 4623. For the day be long above 4591 and short below this.

Best of luck to everyone for the trades today.


allvoices

Monday, August 24, 2009

Update for 25 Aug 09…

 imageSo we have the same situation wherein the FIIs are having a ball of the time purchasing and the DIIs seem to have resigned to the idea that the upswing is here to stay and it is best to board the bus. imageThe run up seems to be here to stay for the time being atleast. The entire world is getting convinced that the upswing is there to stay. Mind you that if we do test 4700 this time around then it would be the third time this level will be tested and if it breaks – which is likely – then the upper limit is way up.

Daily 24 Aug 09 Let me not waste any more time and start with the global cues. It should be left to no doubt that the global cues have had a big hand in propelling our markets ahead in a big way. The Asia today closed strong with Nikkei gaining 3.35%, Hang Seng closing 1.67% up and Strait Times up 2.65%. The Europe too opened strong – traded the day in a fairly narrow band (not unlike what is happening in our markets now a days) and closed fairly strong. FTSE was up 0.93%, DAX up 1.04% and CAC seemed to be closed – as there is no update on Yahoooooo. The US opened in green but around the flat line – went on to good highs but does not seem to be sustaining there – it is back to the flat line and if it does close red then it will be a red closing after going green after a long long time. As I write the blog the US is just past its mid session and Dow is down 0.02% in red, Nasdaq 0.25% in red and S&P down 0.13% in red. Mind you the markets touched the highest for the 2009 year before retracting.

As far as our charts are concerned the third with candle signifies thee soldiers and is generally a signal for a good time to come. The candles went past the middle of the Bollinger bands and may test the highs(upper band) at around 4736 – of course that is conditional to good global cues. otherwise we remain range bound. On 315 the 3EMA line is above the 15 EMA line so the trend is up as per that.20 and 15 EMA lines are also criss crossing each other and as of now the 13 EMA has closed above the 20 EMA line supporting the present uptrend. The volumes were a shade better than what we have seen past few days. It was 82% of the past 50 day average. Gentlemen – here lies my concern – the ADX is still trailing at 14 – and this is the reason inspite of seeing this upswing and my desire to catch it before it runs up – I exercise restraint. put call 24 Aug 09There is no strength whatsoever in this upmove as per ADX and mind you there are people who may swear by ADX. The MACD is showing all the signs of a bullish crossover and by my experience now – the MACD does not do such frequent crossovers in trending markets so this may be another false move. The crossover did not happen and MACD is still bearish. Those who do swing trading in such tight times also – for them RSI is bullish. TRIX seems neutral and Slow Stochastic are bullish and not yet near the overbought territory so bulls can breath with ease as far as this is concerned.

As far as the options data is concerned – have a look at the put build up and the call disappearing in thin air. Though we can still not call it extreme – but this level of put build up can certainly resist the markets going down – at least in this expiry. The Open interest (high to low) is as follows for the nifty contracts. Put 4400>Put4300>call 4700>put 4500>put 4600>put 4200.

imageSo to summarise – if the global cues remain what they are – then ideal strategy should be to remain long. The stoploss for the longs should be closing below 4444 and if someone is holding shorts then stoploss should be close above 4563. For intraday go long above 4545 and short below this level. Before I pen off for the night – some food for thought. The Baltic index can shed light as to what lies in store for us. It would be prudent that everyone reads the article by clicking the Index chart and get grip of what it means.


allvoices

Update for 24 Aug 09…

image

You want me to place my bets in this upmove? See the FII/DII data – the purchasing by the FIIs does not at the moment show too much of enthusiasm. The markets are perhaps  being forced to be kept range bound – and that may remains so till the expiry. On Friday the markets moved up with a sudden drop in open interest in 4500 Calls. Now the range may be dictated by a different level in Nifty but all the same the range is likely to remain till such manipulations disappear. The second factor working in favour of the markets at the moment (negate the China factor) is the fact the globally there is a talk of being high and dry out of recession. The results coming out an the various forecasts may be pointing towards that. Finally all the world markets are waiting for me to become bullish – it is only then the bears will get a signal to strike. It will be when you me and the tom around the corner  is convinced that we are out of the woods and when we reach the other bank – we will stare with complete disbelief and the markets will fall. That they are not falling means that everyone is still not board the bull bus.

Daily 21 Aug 09 As far as the Global cues are concerned – Asia had ended down in red on Friday  inspite of an effort to recover from the lows of the day. Nikkei was down 1.4% down, Hang Seng down 0.64% and Strait Times down 0.58%. Ofcourse – Asia should open and try to recover some lost ground when it opens on Monday. Europe opened red and then steadily climbed to end at almost the highest – FTSE up 1.98%, DAX up 2.86% and CAC up 3.15%. The US too – after opening on a positive note went on to climb and end at almost the highest – Dow was up 1.67%, Nasdaq up 1.59% and S&P up 1.86%. As expected the Asia has opened with a bang – as I write Nikkei is up 3% and Strait Times up 1.44%.

As far as the charts are concerned – they display the typical confusion associated with range bound markets unable to breakout in any direction clearly. We have had two white candles and we have moved from the bottom of the fairly constricted Bollinger Band to the middle. Now either we come down – to once again test the bottom of the Bollinger band or move on to pierce the middle to go on to the upper edge. The 3 EMA line is just about 7 points below the 15 EMA line and if we have a good day then a buy signal may be generated today on 315. If we have a break up then those pacing their bets on inverted head and shoulders may be the ones cheering. Volumes are low – just 78% of the last 50 day average. Even in this upmove the ADX has not even budged an inch. RSI and Slow Stochastic have generated a buy signal and MACD is still in favour of the bears. TRIX is still looking down. So all in all you can take any stance but like bears earlier – I would be vary of the bulls too. (The ADX as shown in the iCharts is incorrect)

The Put call ratio has moved in favour of the puts. The highest Open interest in the order of high to low is 4300 Put, 4400 Put, 4600 Call, 4700 Call, 4500 Put and 4200 Put. If you observe carefully you will realise that 4500 Call has conveniently disappeared from the scene. So next level to watch out is 4600 and if we do go there then we should ideally have a Put build up at 4500 that would define the range of 4500 to 4600 till expiry.

So all in all to summarise – Global cues are rocking for bulls. Indicators on the charts started favouring bulls – Option data defined a new range – above the earlier range as the favoured range for expiry. So all in all we can test the upper Bollinger Bands. Best of luck to everyone for the today.


allvoices

Tuesday, August 18, 2009

Update for 18 Aug 09…

image We seem to have come made a violent attempt to make a breakout. This has been on the lower side that has been expected by me and my bear fraternity for a long time. So many reasons that the markets were just sweeping below the carpet – and well I think the time has come for the markets to see what the lower side of the life seems like. There has been a Chinese angle to  this meltdown and I think that this was about the time that it happened. In any case if this was to happen then either this or that would have been reason enough. No justifications either side. The markets opened gap down and then the sell off just gathered strength without a respite. Look at the FII data – like I had mentioned yesterday that the FIIs do not seem in any mood to buy into our markets any longer. Now there is another thing that we are perhaps are not considering – and that is that though the DIIs are merrily pumping in money at each level – where do they have their stop losses? (If any – I am certain that since they are playing with my and your money – the stop losses are far away)image And that they will start selling at much lower levels. I pray for my mutual funds. For all those who think that the market has already dropped so much and would not like to jump on the shorts – then think again – the fall has just started and it is of global scale – if what I see purely on the charts alone then there is along way to go and that way is just pointing downwards. The markets should give a confirmation that he trend is down and down only. Okay – now I will try not to get carried away and come to the Brass tracks…

Daily 17 Aug 09 The Global cues are bearish and actually saying bearish without throwing a bucket of red paint on top of it would perhaps convey the situation a bit better. After burning every index and stock in Asia the fire went on to Europe with FTSE down 1.48%, Dax down 2.02% and CAC down 2.16%. US opened well in red and then traded in fairly narrow band to close at the lowest for the day. Dow was down 2%, Nasdaq down 2.75% and S&P down 2.43%. The Asia once again started the day in red but Nikkei is now green up 0.2% – the strait Times – now in early trades is just 0.16% down. The meltdown yesterday was supposedly due to profit taking in the wake of slower-than-expected economic growth in Japan. It has been described as one of the worst single day percentage loss in last six odd weeks.

put call 17 Aug Next I come to the Candle sticks. Frankly what I had expected yesterday was a piercing candle – that would go more than two third down the white candle we had on last Friday and that would ideally had been enough to signal a good reversal – but the markets just did not stop there and continued the journey till they took support at the 50 EMA. I have magnified and put the candles up for all to see. The candle had taken a support on 12 Aug and now 17 Aug. 3 EMA has definitely fallen below the 15 EMA and 15 EMA is just 14 points above the 20 EMA – actually poised for a fall below. Already the 315 has generated a sell – second time in last ten days. – now it has to be seen whether we bounce back vigoursly to show that we are range bound or continue down. The ADX gave a sell yesterday and today too the value is 14 – so it will only be in these coming few days that we will know whether this downtrend has enough strength to sustain. MACD remains bearish. RSI generated sell and TRIX is looking down. Slow Stochastic too has turned around but not really given a sell. All in all – majority are either generating sell or justifying a greater downfall of indexes.

As far as the option data is concerned the Put call ratio has reached 0.8866 and open interest is maximum in 4700 call and 4300 put. So on the down side the 4300 may be a difficult nut to crack. Besides this there is a build up in 4600 and 4500 call so upward journey may be as painful with 4700 being the absolute max. The option pain is minimum at 4500 – 4400 range at the moment. Inspite of reliance defying the general bearishness of the markets I was certain that it will never cross 2100 because of the highest call buildup there and now I am even more certain as basically there is only call buildup with very less put writing – so the downside in reliance may be expected more than the yesterday’s 94 Rs odd fall.

To summarise global cues remain to be bearish. On charts all seems favouring the bears though a small bounce cannot be ruled out due to the ferocity of the fall yesterday. The options are still not showing the extreme of sentiments but still favours the bears. Ideal strategy is to remain short – do not hold shorts if likely to close above 4604, If holding log best would be get off the bus at the best levels today – and do not hold longs in any case if closing below 4464. For intraday go short below 4486 and long above it.

Indicator

Bullish/Bearish

Sell/Buy Signal

Nifty at signal

Points gained/lost since (4387)

Remarks

315 Strategy Bearish Sell/17 Aug 4387 -
ADX Bearish Sell/17 Aug 4387 -
MACD Bearish Sell/06 Aug 4586 + 199
RSI Bearish Sell/07 Aug 4387 -  
Slow Stochastic -- -- -- -- No signal
Options Neutral / bearish -- -- --  


allvoices

Sunday, August 16, 2009

Neither a bull – nor a bear… Update for 17 Aug 09…

image … sometimes I seem more like an a**. Well then I suppose that this is the way of the markets. If the 80% will not loose then the 20% will not make a killing and the markets will not be exciting for people like me to sit and stare. Are markets bullish? are they bearish?… A lifetime goes by learning the answers and the markets change with a flick of a switch. But then this is what I suppose the markets are supposed to do in the first place – fox us. In any case if it continues this way – so will I !!. The markets are really caught up in a range and the breakout will ideally give a good opportunity to make money. Now the next question is when will this breakout take place and what direction it will be. Afterall if we do not have these answers in our hand then we will loose out big time. It may be a good idea to sit on sidelines – but then tell me – what man with the right amount of Adrenaline pumped up in his veins will sit ideally on the side lines? Not me – though my heart does skip a beat every now and then. If however the trend is caught right then it is a big achievement. So we need to first break up the question in two parts and then try to see how we can answer both the parts. Also what ever knowledge of technicals I have I will throw them into a box and see the historical data to pick up signals as to when and which side will we have a breakout.

image image The best indicator as I see it – that indicates the range and when we will get out of the range is ADX. (I am talking about only the indicators I follow – and if there is some other then telling me would be great.) ADX ideally – if it under 20 then it is signalling no trend either side. The Upswing lost its momentum of the upswing on 5 Jun 09 and then around 7 Jul 09 it got caught in a trap of no particular trend. Historically the ADX has not been keeping below 20 for too long periods of time – so one can expect a trend moving in a definite direction soon. The lowest was seen in the recent times on 11 Sep 08 at 10. We are presently at 14 and to take directional call now is not the right thing to do. There is no trend – there is just bullish and bearish pulls and pressures and that is all. It is because of this reason really that it is extremely difficult to take a directional call on the market right now. Now something I have not researched my self but ripped off the other blogs. – there is a Head and Shoulders (inverse) that is made and a breakout above 4700 with volumes will carry it higher. Others say that it is a bull trap in making with attempts of the movers and shakers to get retail on the train before pushing it in deep sea. You can pick up any line and tow it and chances are that you have 50% chance to win the prize being right. But also consider the H1N1 and the monsoons. daily 13 Aug 09 These are two things that cannot be wished away. You can click both the maps to get an idea and sense as to where are we headed too. In any case if we go upwards then this was negativity was compensated for and if we don’t then it justifies the downtrend. Two more information pieces that one can consider… the valuations now as compared to the forward projections of 2010 are stretched and FIIs do not seem to be in too much of a rush to put in money in India. Well the last point can be contested and I would welcome it.

Coming to the global cues – the day of upswing has died down fairly fast. Asia was still reeling from the upswing so closed green – Nikkei up 0.76%, Hang Seng up 0.15% and Strait Times up 0.66%. China has had a bad sell of sessions previously and it is just a matter of time we catch up. Europe was flat to green for most of the session but ended definitely red. FTSE was down 0.87%, Dax down 1.7% and CAC down 0.83%. Of course it was US that had dragged the Europe down and US by itself ended – DOW down 0.82%, Nasdaq down 1.19% and S&P down 0.85% down.

As far as the Charts are concerned – there was a black candle. that could not pierce the white candle. Previously – many a sell off have started after a this black candle coming after a tall white candle. The 3 EMA is comfortably above the 15EMA line and we are in the middle of the constricted Bollinger bands. The bands will expand with a break out now. Volumes are again low. I have already discussed ADX in detail and it remains to be Bullish but trendless.(I repeat that the ADX data as represented in the chart pasted is incorrect.) The value of ADX is 14. MACD remains to be bearish. RSI is bullish but looks down. Slow Stochastic is Bullish. TRIX is looking down. So all in all you can see the amount of confusion that the signals are generating. One can safely wait on the sidelines for the indicators to be in consonance with each other.

put call 13 aug 09 The way the Put call ratio is swinging above and below one – it seems that it is in the best interests of the operators to keep the markets range bound between 4700 and 4500/4300. A break beyond these levels will only make a trend and that would be interesting. All the same I would like to add that 4700 on the upside may turn out to be a tough nut to crack by the bulls.

So to summarise the Global cues are once again bearish. Technicals are mixed at the best and options data too show call and put writing changing every day – either we remain range bound till there is a definite thrust in one of the direction. The best strategy would be to sit on the sidelines. However if you are upto it then for longs keep stoploss 4459 and for shorts keep a stoploss of 4569. For day trading – buy above 4551 and sell below this level. Best of luck to everyone. May you all make money.


allvoices

Friday, August 14, 2009

Update...

Sorry I will not be able to update today due to my schedule...


allvoices

Wednesday, August 12, 2009

Update for 13 Aug 09…

image image Hey guys am I missing something or there is some error in the FII and DII data? It has been ripped out from directly from the NSE site so I presume that the data presented is correct and the FIIs continue to be net sellers. Did it mean that after the FIIs had done with their selling the DIIs threw in whatever they could to save the markets from the massacre? I really do not have answers for this and neither did I find any solutions. In any case it has been my experience that not all share their experience or let us say knowledge – may be they are more busy making money. 

The global cues are against the markets at the moment – let us start from one side. Asia was what we saw and reacted to – it was the colour of blood. Nikkei down 1.42%, Hang Seng Down 3.03% and Strait Times down 1%. Europe took cues from that and opened flat and fell, soon the markets there however started to improve and continued to go higher finishing at the highest for the day. Of course the US trend laid the path for the upswing. The US too started flat but soon went on to touch new highs – now in md session trading flat at around their best levels. Dow as of now is 1.25% up, Nasdaq up 1.64% and S&P up 1.21%. I am enclosing the write up from the Yahoo finance that I find it important that you go through and know what is happening.

I quote…

image Stocks jumped in light trading Wednesday as investors awaited the Federal Reserve's interest rate announcement. Major stock market indicators rose more than 1 percent, including the Dow Jones industrial average, which gained 120 points to reverse a sharp slide Tuesday.

For months, investors have been looking for evidence that the economy is strengthening and pulling out of recession. Traders pay particular attention to the Fed's assessments of the economy. The latest is due at 2:15 Eastern when the central bank concludes a two-day meeting on interest rates.

daily 12 Aug 09It is widely expected that the central bank will hold the federal funds rate near zero. What investors are uncertain about it how the Fed will size up the economy -- whether it sees further signs of strengthening that would justify the gains in stocks since the spring.About four stocks rose for every one that fell on the New York Stock Exchange, where volume came to 439.1 million shares, compared with 503.4 million shares traded Tuesday. Light volume price moves and could be overstating investors' enthusiasm ahead of the Fed decision.The market is bouncing back a day after posting its biggest loss in five weeks. The Dow slid 1 percent and the S&P 500 index lost 1.3 percent. (Source: Click Here)

Coming to my favourite – the technicals. The candle was a hammer and purely from the candles point of view it can signal a reversal – reversal from the present downtrend. But also importantly it the candle just shied a dot short of hitting 50 EMA running at 4342. The 3 EMA remains firmly below the 15 EMA and as of today also crashed below the 20 EMA standing on top of 25 EMA exactly at 4471. SO on that account the bears should not really loose their sleep. The volumes were still low. The ADX has improved by a point to be at 17 – but that too is weak still. MACD is still bearish and the divergence has increased – mind you. RSI is at 49.7 and today too I will disregard it as a bearish crossover. We will give it another day. TRIX is looking down and Slow Stochastic while still remaining in oversold territory has generated a buy signal. Very fairly and squarely we remain bearish as far as the technicals are concerned. What you also see in this chart on the left is the dots of the Parabolic SAR (10, 2 , 20). They too are red as of now.

The options data has no change so the Put call remains a shade below 1. So all in all the Global cues are likely to remain strong in view of the Fed meet outcome. The Hammer and Slow Stochastic can signal bullish run whereas ADX, MACD, TRIX continue to signal bearish undertones. Options are not likely to play a role except the 4700 being a strong reistance upwards.

Indicator

Bullish/Bearish

Sell/Buy Signal

Nifty Level at signal

Points gained / lost since (4457)

Remarks

Harami - - - - Signal has played it part and buried
Hammer Bullish (reversal) - - -  
315 Strategy Bearish Sell / 10 Aug 4437 (-) 20  
ADX Bearish Sell / 07 Aug 4481 + 24  
MACD Bearish Sell / 10 Aug 4437 (-) 20  
RSI - - - - Disregarding – waiting for a clearer indication
Slow Stochastic Bullish Buy / 12 Aug 4457 0  
Options Neutral - - -  
So we might be reaching the stage where it might be wise to sit on sidelines especially if the market close in green. All the same the best strategy as of now would be to remain short. Do keep a stoploss for the shorts at 4516 on closing and if you are long then do not hold if the market closes below 4386. For the day – if market is above 4483 – go long and below it go short. Best of luck to everyone for tomorrow.

Explanation given by ID Stockstar for my first Paragraph on ‘Stockezy’ on 12 Aug:

Well cash selling many times used just as one way of doing cross arbitrage!

Like when nf shorted at 4700 level with call writing done and put buying done....also stock future shorting done.......so only thing that remains is using cash stocks to bring it down....so cash basket selling used to help make all 3 trades in profit. now question remains what happens to cash stocks......if they want to keep trend up they just buy more stock futures at bottom and reverse nf future and option positions.....and now how to take nifty uppppppp take it up with spot cash buying in nifty stocks and nifty future buying!

If u see all data in toto for last 10 days u can make out!

TO highlight more.....when nf was at 4700 for three days nf was rising with lower nf future volume and stock future short positions were added up and call writing was on.....more so in medium term nifty calls like sept and nf was waiting to dip yesterday nearly all positions started reversing hence thats reason for strong pullback today as they defend lower put writing very well in closing!

Hence now swing trade wise unless 4350 breaks in closing basis trend is up!

allvoices

Tuesday, August 11, 2009

Update for 12 Aug 09…

image I have searched high and low for the answers to the questions that have been hounding my mind seeing the markets today. They opened as per the expectations… so far so good – then went on to show strength – suddenly sold off with a bounce again. I wonder those sitting with tons of certificates in finance and economics are not the ones jittering like this. But then what the hell – it happens every second day. The moves were extremely sharp and am sure that only the fast fingers would have got anything worthwhile fishing in these waters. The FII data streaming in is not really bright from any angle except that they have not sold the whole lot like they did yesterday and day before. The DII seems to have become pretty active – the moot point will be to see how long FII withdraw and DII keep pumping in money. There is tons of money in our country that sits in the side lines. That is okay but historically a vast majority will never flow into the markets at any rate. Another angle is the money being sucked out due to the IPOs that have been open and are to come in the next few days.

daily 11 Aug 09 As far as the global cues are concerned – they are not good at the moment – what can happen till morning is --- uhh !! not likely to become good – but then as I sleep the world turns around. Asia was good – we had Nikkei up 0.58%, Hang Seng up 0.69% and Strait Times – the one that was not trading yesterday make most use of the lost time and ended up 1.88%. I will not talk about our levels as shown close after adjustment were far away from where they were at the moment. – they were green nevertheless. Europe had opened green and perhaps that was the strength that was with us to remain green – all the same the Europe thereafter nosedived to close at the day worst levels. FTSE was down 1.08%, DAX down 2.44% and CAC down 1.38%. US has reached its mid session and no – it is nowhere good as of now. They are waiting for the beginning of two day feds meeting. As of now Dow is down 1.07%, Nasdaq down 1.38% and S&P down 1.36%.

image As far as our technicals are concerned – there is no good news inspite of this bounce in green that we had. Let us see the details… 3 EMA first had crossed below the 15 EMA and now it is below the 20 EMA. So shorts rejoice. We are past the middle of the Bollinger Bands on the down side now – it remains to be seen when and how we hit the bottom of the lower Bollinger band. Bollinger bands are constricting and I – being the bear I am at the moment am not interested in at the moment. The volumes were low – 74% of the last 50 Day average. Do not look at the ADX in the chart – I have already written to iCharts that their values are incorrect and they have promised to rectify them – till then the ADX reading is 16 – weak trend. So I am really waiting for a value above 20 while the markets fall for it to be classified as a down trend as per this. All the same the sell signal remains. MACD is bearish. RSI is at 50.53 so I will disregard the bearish indication that it had generated yesterday. put call 11 Aug 09 Slow Stochastic is bearish but oversold. Remember – if we are indeed in a downturn then it can remain oversold for pretty long – so keep aside the worry for some time. The TRIX – the leading indicator is looking down.

As far as the options data is concerned not too much of change – nor any out of the way build-up at any levels so the same holds true for today as yesterday. So I will summarise – the Global cues are likely to remain weak tomorrow. Technically markets are weak and likely to have a greater down side in the days to come. The ideal strategy is to go short or remain short who initiated them earlier. Stoploss for shorts is 4555 and absolute stoploss for longs (if anyone is holding) is 4421. For day trading be long above 4500 and short below it. The fireworks will start only below 4388 levels. And mind you there is a strong support there.


Indicator

Bullish/Bearish

Sell/Buy Signal

Nifty level at signal

Points gained/lost since 4471

Remarks.

Harami Bearish Sell / 04 Aug 4681 +210  
315 Strategy Bearish Sell / 10 Aug 4437 - 34  
ADX Bearish Sell / 07 Aug 4481 + 10  
MACD Bearish Sell / 10 Aug 4437 - 34  
RSI - - - - Disregarding – waiting for clearer indication.
Slow Stochastic Bearish Sell / 05 Aug 4694 + 223  
Options Neutral - - -  
I would like to wish every one for tomorrow’s trades.


allvoices

Market update for 11 Aug 09…

  imageThe markets have played out in the hands of two events for last three days, firstly the bears and secondly the technicals. It is a question of what came earlier – the markets or technicals. At some stage of life they both have intertwined so much with each other that it is frankly extremely difficult to tell. Well – still all the same they have atleast given us the opportunity to see how the markets will shape out. The FIIs at the moment seem to have become a major problem. They are sucking out liquidity out of the system and the DIIs can never catch up. It may so happen that the DIIs also give up and what a day it will be. Hope that it will not come in a hurry. In any case I will stop babbling about all this and get to the task at hand. All the same before I begin with reading of the data – we have at the moment some not so news around us. A semi agrarian society at the best that relies on monsoons have deficit monsoons. A population of a billion plus having less than good health facilities – with Swine flu knocking in the backyard. Enough to give anyone jitters. Add to it a pint of Chinese bubble about to go bust etc. A perfect recipe for disasters on the markets. Not that if all goes well it matters – then a single statement that this has been factored in in the markets will see it through – but unfortunately that is not the case. So except trouble in the short term.

daily 10 aug 09 As far as the global cues are concerned – things were poised for a bounce – and a strong one at that. All the same Nikkei ended 1.08% green, Hang Seng 2.72% green and Strait Times was closed. Europe opened red and made a half hearted attempt to recover but apart from FTSE – none did. FTSE closed 0.68% green, DAX red and CAC red 0.75% and 0.47% respectively. US opened red – tried to recover but has since sunk deeper red. DOW is presently 0.48% down, Nasdaq down 0.67% and S&P 0.53%. They do have a lot of time in hand to attempt a recovery – we will have to see it at their close tomorrow.

image The candle today was another black one – though it is not a perfect ‘three crows’ bearish pattern – it is very close to it. As far as this pattern is concerned expect some more down turn. We have already violated the middle of the Bollinger bands now all we have to do is to test the bottom of the bands. 3 EMA has crossed below the 15 EMA and has generated a sell signal. Volumes were low – lower than yesterday at 79% of the 50 day average. ADX had already generated a sell signal and remains weak. If it comes above 20 then – at the moment it will give strength to the bears. MACD has generated sell. RSI generated sell signal and Slow stochastic bearish. Only small caution with the Slow Stochastic is that %K line has entered oversold. Does not really matter as of now but will build up in time to come.

put call 10 aug 09 Options data now has a good amount of call writing going on so be prepared for a painful recovery if any. The way 4700 calls are being build up – forget reaching above it for this expiry. If meaningfully 4400 is broken tomorrow then a run up (or may I say down) to 4300 is quite possible.

To summarise the global cues have turned weak. Majority of technicals I follow on the charts have generated a sell signal. Would be ideal to sit tight on shorts and till there is some kind of turnaround – no longs. Option data does not suggest extreme of sentiments but call build up is going on. It will be a time before options meaningfully sway the markets. As per the options the levels to watch out for are 4700 on the up side and 4400 and 4300 on the down side. (4400 if breached – likely to force option sellers to cover or hedge positions – helping the market fall)

So to wrap up Ideal strategy is to go and remain short. Stoploss for shorts is 4624 and stoploss for those carrying longs is 4474. For the day go short below 4519 and long above 4519.

MARKET SUMMARY

Indicator

Bullish/Bearish

Sell/Buy Signal

Nifty level at signal

Points gained/lost since

Remarks

4437
HARAMI Bearish Sell / 04 Aug 4681 244  
315 STRATEGY Bearish Sell / 10 Aug 4437 0  
ADX Bearish Sell / 07 Aug 4481 44  
MACD Bearish Sell / 10 Aug 4437 0  
RSI Bearish Sell /10 Aug 4437 0  
Slow Stochastic Bearish Sell / 05 Aug 4694 257  
Options Neutral - - -  


allvoices

Sunday, August 9, 2009

Markets, Markets…. crazy markets…. Update for 10 Aug 09

image Actually one does not call them crazy – it is so very understood by everyone who has been in the markets for whatever time that they are crazy and they have a mind of their own. All the same the desire to tame them would be aim of anyone who dreams. See for example the way the markets behaved last two days. they followed the dictum of the candles to the core and then stopped just a needle bit short of turning the indicators bearish. Ofcourse I will be substantiating whatever I say – but for the time being suffice to say – they showed arrogance inspite of being poised for a fall more severe that what we witnessed. We once again stand at crossroads and stare at the way to go. There is a way this side and the other. I have to choose the path of the markets otherwise I will be lost in the forest filled with everyone to take a snipe at what is mine. I have deliberated on what I should put across this weekend. I even thought about skipping this one update and write when there would be more clarity about the direction. It is never easy to say sorry in the hindsight.

daily 07 Aug 09 The markets went the way they were supposed to – fall they did… The Harami played exactly as in a text book – but then why am I afraid? Am I afraid because of the way the US and the European markets fanned out – closing the trades for the weekend? Yes and maybe. Fact remains that they were not supposed to close strong – it could be the head of a snake making one attempt to surprise – the last bit of effort to show that it will dare – or it may be the strike with vengeance that can take us to the new heights. Whatever it would be it is time to be on our toes and keep a watchful eyes – the markets can go either side with strength not giving any time for us to think and act.

imageComing to the global cues the markets started in Asia as flat to green but kept going down to close at – Nikkei – the only oasis of green at 0.23% up, Hang Seng down 2.51% and Strait Times down 2.05%. Europe too opened red but by mid day it was clear that the US cues are overtly positive and that led to a sharp rally with the markets ending comfortably green with FTSE at 0.87%, Fax up 1.66% and Cac up 1.25%. As the two major areas of concern – namely the housing and employment came better than expected the US rallied right from the beginning to close – DOW up 1.23%, Nasdaq up 1.37% and S&P up 1.34%. So it goes without saying that the global cues are looking good.

 put call 07 aug 09Now here is the trouble area – ideally the fallout of a confirmed Harami should be continued selling pressure. Yesterday panned out to be the second day of selling – ideally beginning of many to come. Now the 3 EMA line – it is just shy of crossing below the 15 EMA at 4537. If this crossover does not happen then it will be a signal to build up longs and square off shorts. Volumes again fell to 84% average of last 50 day traded. ADX has just generated a sell signal with a –DI crossover of +DI. MACD is one point short of generating a sell signal. RSI is one point short of generating a sell signal. Slow Stochastic is already in a sell mode.

As far as the options data is concerned the call build up has quickly filled out the available calls with the Put call ratio dropping below 1 to 0.97. remember it was 1.1 on Thursday? The data of the main strike prices is as in the table above. The call build up is at 4700, 4800 and 5000. So basically as per the option data the fight between the bulls and bears is on and no one knows where the market will go. The levels of 4700 on the upside and 4500 & 4300 important levels on the lower side are important. The 4500 level is already in money.

So all in all the global cues are bullish. The technicals that I follow are either already bearish or turning bearish. If these indicators take support at these levels then a strong bounce back can happen – but if they breach these levels then we are on our downward journey. Options are as of now on sidelines only – will give pauses at 4700 levels on the upside and 4300 on the lower side.

Indicator Bullish/Bearish Sell/Buy Signal Nifty level at signal Points gained/lost since
(4481)
Remarks
Harami Bearish sell / 04 Aug 4681 + 200 Harami confirmed as bearish
315 Strategy - - - - 20 points short of generating sell signal
ADX Bearish sell / 7 Aug 4481 +/- 0  
MACD - - - - 1 point short of generating sell signal
RSI - - - - 1 point short of generating sell signal
Slow Stochastic Bearish Sell / 05 Aug 4694 +213  
Options Neutral        

One may either sit on the sidelines for a day or be positional short at the moment. For the day sell below 4574 go long above 4574. For those positional short keep stoploss 4676 and if you are long do not hold below 4551. Best of luck to every one. Whish you all make money…


allvoices